Adding Lambda Custom Metrics the Easy Way
aws-embedded-metrics npm package FTW

Overview
Custom metrics are a powerful way of instrumenting your applications. This allows you to observe the health and performance in near real time. This post explores custom metrics and how you can use the aws-embedded-metrics npm package to easily add them to your Lambda functions.
TL;DR
- Custom metrics allow you to instrument your application
- The
aws-embedded-metricsnpm package makes it straightforward to add them - A knowledge of dimensions, metrics, and properties is essential
What are CloudWatch metrics?
The AWS documentation (Using Amazon CloudWatch metrics) describes metrics as follows:
Metrics are data about the performance of your systems. By default, many services provide free metrics for resources. You can also enable detailed monitoring for some resources or publish your own application metrics. Amazon CloudWatch can load all the metrics in your account (both AWS resource metrics and application metrics that you provide) for search, graphing, and alarms.
For Lambda functions, AWS is already collecting the following metrics and more automatically for you:
- Invocations
- Duration
- Errors
As mentioned in the documentation, these metrics can searched, graphed, and alerted on.
For example, here is a graph showing average duration:
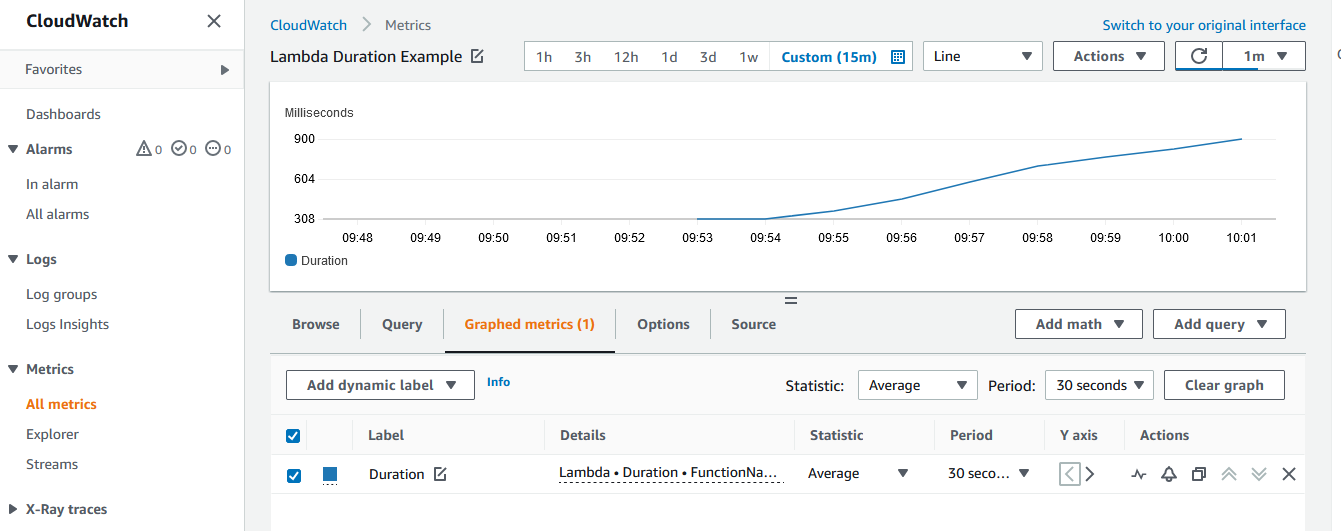
These metrics can be very useful to set alarms on. For example, it is important to know if your application is suffering from excessive errors or throttling. These can be alerted on with the built-in metrics.
Introducing custom metrics
These default metrics are very useful to understand and monitor the health of your application, but they can only go so far. What if you wanted to monitor the health or performance of an external API? What if you also wanted to be able to query the performance for a particular request or particular response? Well, with custom metrics, you can do all of these things.
The AWS user guide (Publishing custom metrics) says the following:
You can publish your own metrics to CloudWatch using the AWS CLI or an API. You can view statistical graphs of your published metrics with the AWS Management Console.
This all sounds great, but how can you create custom metrics for a Lambda function?
If you are developing in Nodejs, then one answer is the Amazon CloudWatch Embedded Metric Format Client Library (awslabs/aws-embedded-metrics-node). This npm package takes advantage of the embedded metric format to generate CloudWatch Metrics via structured log events.
The AWS documentation on the embedded metric format describes it as follows:
Embedded metric format helps you to generate actionable custom metrics from ephemeral resources such as Lambda functions and containers. By using the embedded metric format to send logs from these ephemeral resources, you can now easily create custom metrics without having to instrument or maintain separate code, while gaining powerful analytical capabilities on your log data.
Essentially, by logging in a specific format CloudWatch automatically extracts the custom metrics for you. The awslabs/aws-embedded-metrics-node package makes this straightforward to do.
An overview of our example
Our example consists of a mock API endpoint and a Lambda function that calls it. The mock API endpoint is made up of an API Gateway, backed by a Lambda function, and a Lambda function that calls the endpoint using the axios npm package.
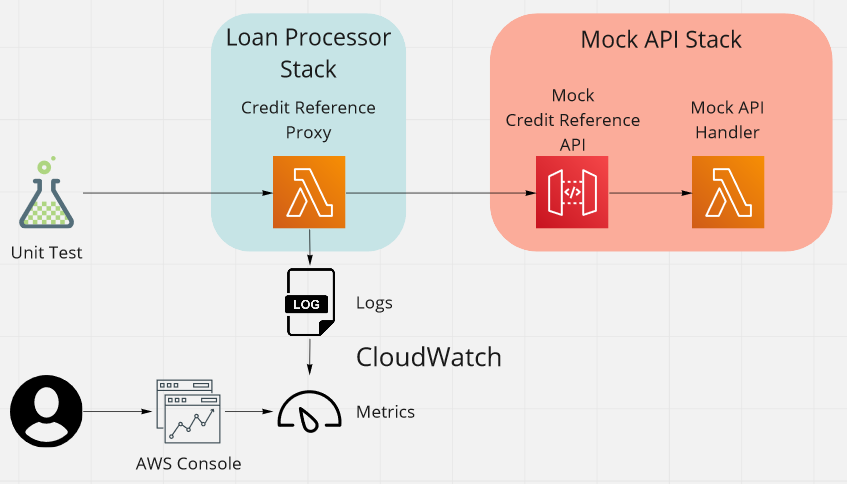
The Lambda function behind the mock API has a set of environment variables that allow us to configure the response time and the error rate. This will enable us to get some interesting metrics when we test.
When it comes to metrics, the first question we need to answer is what information do we want. In this case, we want to be able to graph the average duration of the HTTP calls to the mock API endpoint. To do this we need just one metric, the response time.
Instrumenting our example
Below is the code starting point for our example. It simply uses the axios post method to get a response, and then logs the response time.
const callEndpointAsync = async (
  request: CreditReferenceRequest
): Promise<AxiosResponse<CreditReferenceResponse>> => {

  const startTime = Date.now();

  const response = await axios.post<
    CreditReferenceResponse,
    AxiosResponse<CreditReferenceResponse>,
    CreditReferenceRequest
  >(`${endpointUrl}request`, request);

  const responseTime = Date.now() - startTime;

  console.log(JSON.stringify({ responseTime }, null, 2));

  return response;
};
The aws-embedded-metrics library allows a number of different usages. In this case, we are going to wrap our function in a metricScope so that the metrics will get flushed automatically for us. The documentation has the following snippet.
const { metricScope } = require("aws-embedded-metrics");

const myFunc = metricScope((metrics) => async () => {
  // ...
});

exports.handler = myFunc;
So our example becomes:
const callEndpointAsync = metricScope(
  (metrics) =>
    async (
      request: CreditReferenceRequest
    ): Promise<AxiosResponse<CreditReferenceResponse>> => {
      // ...as before...
    }
);
We now have a metrics instance to use to publish our custom metric. We do this as shown below, calling the putDimensions, putMetric, and setProperty methods:
const response = await axios.post<
  CreditReferenceResponse,
  AxiosResponse<CreditReferenceResponse>,
  CreditReferenceRequest
>(`${endpointUrl}request`, request);

const responseTime = Date.now() - startTime;

// Record our metric
metrics.putDimensions({ Service: "CreditReferenceGateway" });
metrics.putMetric("ResponseTime", responseTime, Unit.Milliseconds);
You can see here that, at their most basic usage, metrics are made up of two types of values, that is dimensions and metrics. Knowledge of what these types are are a key to getting the results you want and avoiding unintended costs.
Dimensions, metrics, and properties
A metric is a measurable quantity, that is it has to be expressed by a numerical value. For example, a duration, a count, a percentage, or a rate.
Dimensions are what the metric is recorded for. In our example, we are recording the response time for a credit reference gateway. So we have used a dimension we have named Service with a value CreditReferenceGateway. We can specify multiple dimensions, but this has a cost.
Each combination of dimension values creates a separate metric, and each metric has a cost. For example, imagine if we did the following:
metrics.putDimensions({
  Service: "CreditReferenceGateway",
  RequestId: request.requestId,
});
metrics.putMetric("ResponseTime", responseTime, Unit.Milliseconds);
We would then be creating a custom metric for each request. This would be both be meaningless and potentially expensive. This is because AWS charges by the number of custom metrics used. If you publish a custom metric, then you are charged an hour's usage. The first 10 custom metrics are free, but the next 10,000 are not. For an excellent explanation of the cost of metrics please read CloudWatch Metrics Pricing Explained in Plain English.
A property is a piece of information that is associated with the metric instance. This value is not submitted to CloudWatch Metrics but is searchable by CloudWatch Logs Insights. This is useful for contextual and potentially high-cardinality data that is not appropriate for CloudWatch Metrics dimensions. One example is the requestId seen above.
Generating and viewing metrics
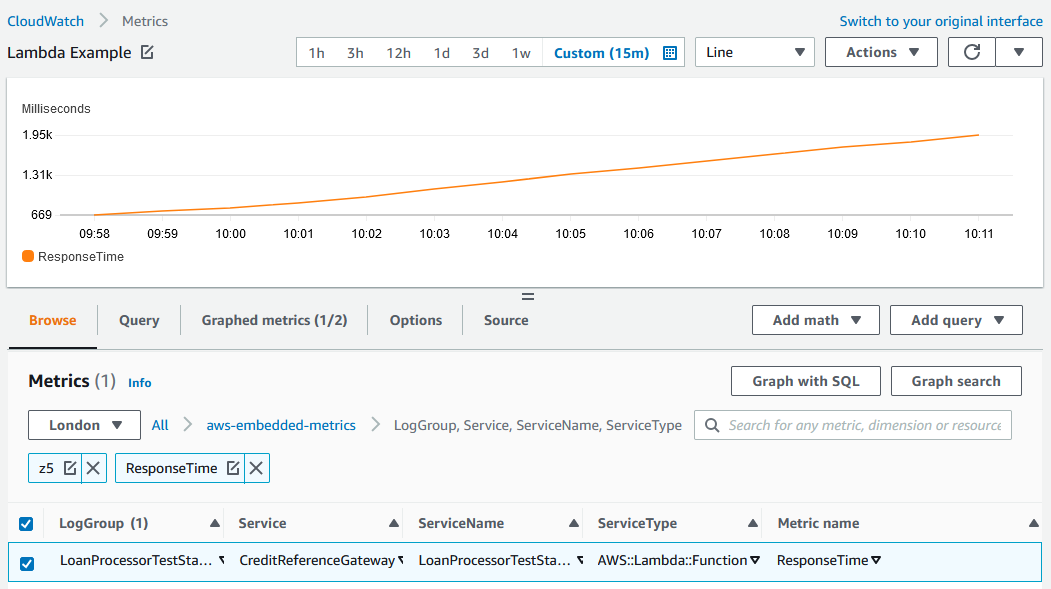
To generate some metrics for us to view, a simple unit test was created to call the instrumented Lambda function. This test runs for several minutes to provide metrics over a viewable range.
Here is an example of a minute run, with the mock API configured to respond more slowly over time.
Summary
In this post, we looked at how we can use the aws-embedded-metrics npm package to add a custom metric to a Lambda function. We also looked at the concepts of dimensions, metrics, and properties and why they are important to getting the results you want and avoiding unintended costs.
There is a lot more to custom metrics and I intend to cover some of that in the next post. However, given the basics above, you should be able to start adding custom metrics to your Lambda functions and improving your observability.