Enterprise Integration Patterns - Domain Observability

In the first two parts in this series, we first looked at choosing a messaging technology and then looked at how we can design the domain events that flow through the application. In this part, we will look at how we can use those domain events to implement an observability stack. This stack will output a range of business metrics that can be used to provide visibility of the system performance and to alert us when this is not as desired.
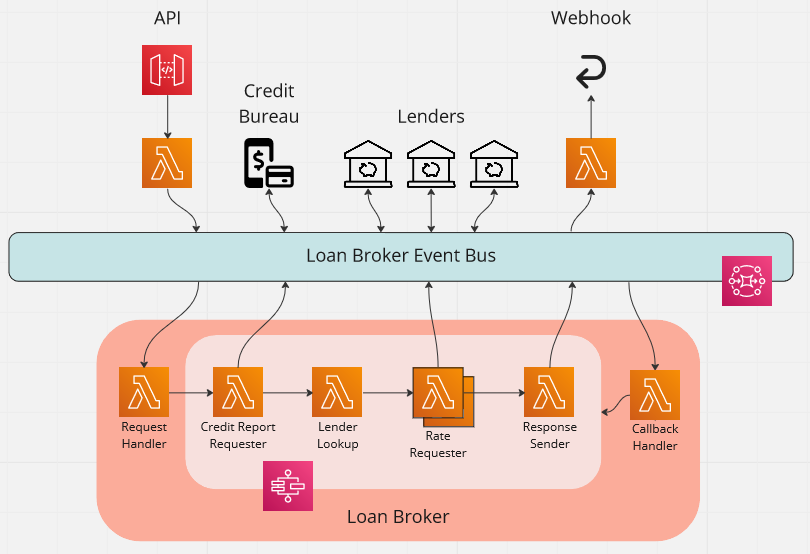
The application in question acts as a loan broker, it receives a request containing the details of the loan required via an API, and then returns the best rate to a webhook.
The following diagram shows how we use a central EventBridge event bus to implement this application using an event-driven design.
The code for this post can be found in the accompanying GitHub repo.
Business metrics vs. System metrics
By default, AWS outputs a large number of metrics that you can use to visualise and monitor the health of your application. For example, the Working with Lambda function metrics AWS documentation page goes into the detail of what is outputted by default by Lambda functions. You get invocation metrics, such as the number of times that your function code is invoked, performance metrics, such as the amount of time that your function code spends processing an event, and concurrency metrics, such as the number of function instances that are processing events.
These provide an invaluable insight into the health of your application, but don't necessarily answer business-level questions such as, "How many quotes are we receiving per hour?", "How fast are we processing them?", or "How many rates are we receiving from lender X?". Whilst AWS provides system metrics, to answer these business-level questions we need business metrics.
This is where we can take advantage of our event-driven architecture. The application is already producing events such as the following:
QuoteSubmittedCreditReportFailedLenderRateReceived
What we can do is subscribe to these events and translate them into custom business metrics. We can then build dashboards, alarms, and whatever else we want on top of those metrics.
Decoupling observability
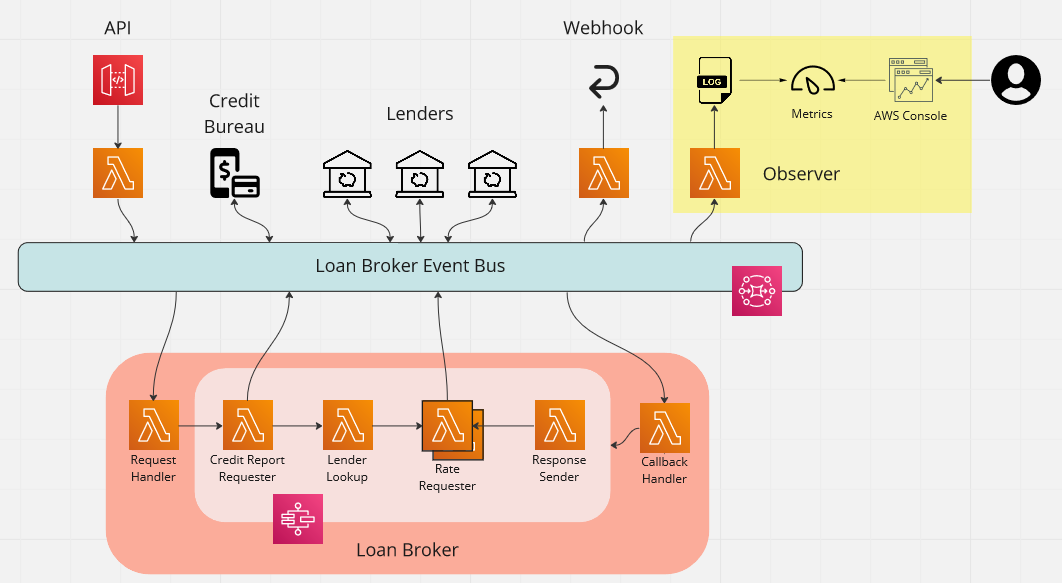
In the first part of the series, we considered using SQS as part of our messaging technology. One limitation of SQS is that each message can only be processed by one consumer. Our use of EventBridge has the advantage that we can subscribe to any business events without affecting any existing processing. This means we can add an observability stack entirely independently of the existing application. This demonstrates the high-level of decoupling that can be achieved and the extensibility you get with an event-driven architecture.
The diagram below shows how we are going add business observability to our architecture. As you can see, it simply plugs into the event bus.
Simple logging and Logs Insights
One simple way to turn the business events into a searchable resource is to log our business events in a structured way. This can be done via the following single-line Lambda function.
export const handler = async (
  event: EventBridgeEvent<'DomainEventBase', DomainEventBase>
): Promise<void> => {
  console.log({ ...event.detail.metadata, data: event.detail.data });
};
This will result in log entries such as the following.
{
  "eventType": "QuoteSubmitted",
  "eventVersion": "1.0",
  "correlationId": "ac702216-ac35-48cb-be3c-26beb523897e",
  "requestId": "35fb604e-c56b-457b-97a8-fbdae9fd0644",
  "eventId": "8e71aecb-839f-4477-a9db-5353e1f23d04",
  "domain": "LoanBroker",
  "service": "RequestApi",
  "timestamp": "2023-01-28T15:05:16.237Z",
  "data": {
    "quoteReference": "2023-01-28-RHJ9YUL71",
    "quoteRequestDataUrl": "https://requestapistack-requestapibucket...-Amz-SignedHeaders=host"
  }
}
We have flattened the metadata about the event, such as the correlation id and event type, and also included the actual data for the event, such as the quote reference. In the second part of the series, we designed our domain events to be self-contained and to be made up from metadata about the event and the event data itself. We are taking advantage of the consistency here to output an easily searchable entry.
We also made another choice when designing out domain events. That was to pass large or sensitive data as time-limited presigned URLs. This choice means that we are free to log the events without the risk of logging sensitive information by accident.
Now we have our structured logging Lambda function, we can look at how we hook it up to monitor our application. To do this we create a CDK construct as shown below.
export interface ObserverProps {
  loanBrokerEventBus: EventBus;
}

export default class Observer extends Construct {
  constructor(scope: Construct, id: string, props: ObserverProps) {
    super(scope, id);

    const loggerFunction = new NodejsFunction(this, 'Logger');

    const domainEventRule = new Rule(this, id, {
      eventBus: props.loanBrokerEventBus,
      eventPattern: {
        detail: {
          metadata: {
            domain: [EventDomain.LoanBroker],
          },
        },
      },
    });

    domainEventRule.addTarget(new LambdaFunction(loggerFunction));
}
The construct properties allow us to pass in the event bus to subscribe to. We create our Lambda function, along with a rule that will listen to all domain events in the application. Finally, we add our Lambda function as the target for the rule.
The final step is to define a stack and add it to the application.
export interface ObservabilityStackProps extends StackProps {
  loanBrokerEventBus: EventBus;
}

export default class ObservabilityStack extends Stack {
  constructor(scope: Construct, id: string, props: ObservabilityStackProps) {
    super(scope, id, props);

    new Observer(this, 'Observer', {
      loanBrokerEventBus: props.loanBrokerEventBus,
    });
  }
}

new ObservabilityStack(app, 'ObservabilityStack', {
  loanBrokerEventBus: messagingStack.loanBrokerEventBus,
});
With this Lambda function in place, we can now use CloudWatch logs to see all the domain events in a single place.
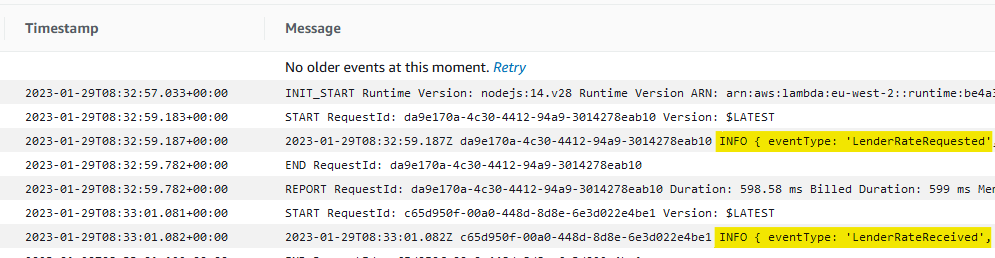
We can take advantage of log filtering to provide a more focussed view of the events.
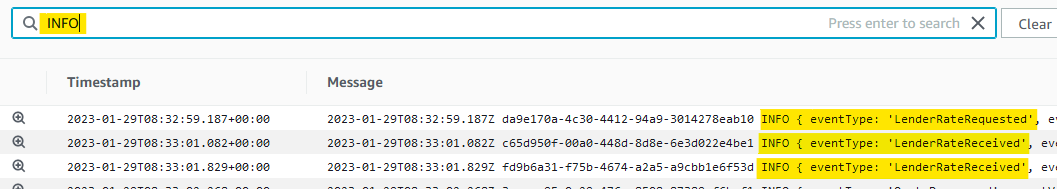
However, we can do even better by using CloudWatch Logs Insights. To quote the article:
CloudWatch Logs Insights enables you to interactively search and analyze your log data in Amazon CloudWatch Logs. You can perform queries to help you more efficiently and effectively respond to operational issues. If an issue occurs, you can use CloudWatch Logs Insights to identify potential causes and validate deployed fixes.
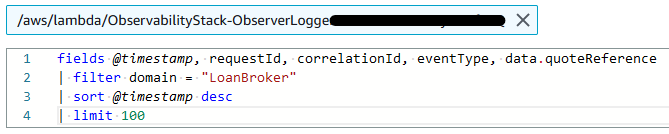
This allows us to run a query such as the following and get a picture of the domain events flowing through the system.
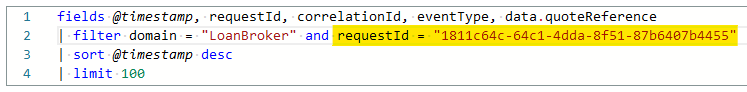
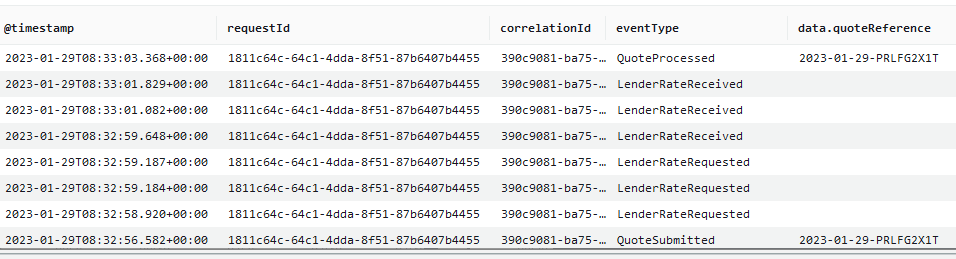
As we log correlation ids, we can use these when we want to focus in on a particular request by adding criteria to our queries. The query below show how this is done.
Logging business metrics
As well as outputting structured logs, we can also use this subscription to publish custom Amazon CloudWatch metrics. By publishing custom metrics we can create dashboards and alarms.
To make our lives easier, we are going to use the AWS Lambda Powertools for TypeScript Metrics npm package. This will allow us to create custom metrics asynchronously by logging metrics to standard output following Amazon CloudWatch Embedded Metric Format (EMF).
The metric we are going to capture is a count of how many times the call to the credit report service has failed.
We start by declaring a Metrics instance outside of the Lambda function handler. We assign it a namespace and service name using exported constants, which we will use later for setting up an alarm.
import { Metrics, MetricUnits } from '@aws-lambda-powertools/metrics';

export const METRICS_NAMESPACE = 'LoanBroker';
export const METRICS_SERVICE_NAME = 'observer';

const metrics = new Metrics({
  namespace: METRICS_NAMESPACE,
  serviceName: METRICS_SERVICE_NAME,
});
The next step is to create the handler to publish the metric. First, we create a function to publish a count of all the failure events. Along with adding one to the overall count, we also publish metadata about the metric. This includes as much contextual information as possible, so that the resulting log entry can aid us in debugging what failed.
export const CREDIT_REPORT_FAILED_METRIC = 'creditReportFailed';

const publishCreditReportFailedMetrics = (
  creditReportFailed: CreditReportFailedV1
): void => {
  metrics.addMetric(CREDIT_REPORT_FAILED_METRIC, MetricUnits.Count, 1);

  addMetadata(creditReportFailed, {
    quoteReference: creditReportFailed.data.quoteReference,
    error: creditReportFailed.data.error,
    executionId: creditReportFailed.data.executionId,
    executionStartTime: creditReportFailed.data.executionStartTime,
    stateMachineId: creditReportFailed.data.stateMachineId,
  });

  metrics.publishStoredMetrics();
};
Now we have our function to publish the metric, we create a handler with a switch statement to route the event to our function.
export const handler = async (
  event: EventBridgeEvent<'DomainEventBase', DomainEventBase>
): Promise<void> => {

  switch (event.detail.metadata.eventType) {
    case EventType.CreditReportFailed:
      publishCreditReportFailedMetrics(event.detail as CreditReportFailedV1);
      break;
    default:
      break;
  }
};
Finally, we add a subscription using the domainEventRule we created earlier.
const measurerFunction = new NodejsFunction(
  this, 'Measurer', getNodejsFunctionProps()
);

domainEventRule.addTarget(new LambdaFunction(measurerFunction));
Now that we have a metric for our failures, we can create an alarm to notify ourselves when the failures are occurring. For the purpose of this post, we create a simple alarm that triggers if there is at least one failure in a five minute period.
const creditReportFailedCount = new Metric({
  namespace: OBSERVER_NAMESPACE,
  metricName: CREDIT_REPORT_FAILED_METRIC,
  dimensionsMap: {
    service: OBSERVER_SERVICE_NAME,
  },
}).with({
  statistic: 'sum',
  period: Duration.minutes(5),
});

creditReportFailedCount.createAlarm(this, 'CreditReportFailedAlarm', {
  evaluationPeriods: 1,
  comparisonOperator: ComparisonOperator.GREATER_THAN_THRESHOLD,
  threshold: 0,
  treatMissingData: TreatMissingData.NOT_BREACHING,
});
We can repeat this process for any of our domain events, creating metrics and alarms that allow us to observe the business performance of the application.
Deriving business metrics
Some business metrics directly correlate with individual business events, such as CreditReportFailed as we saw previously. However, there are some business metrics that do not. One example is the length of time is takes to process a quote. This process is asynchronous and, as a result, there is no single place within the application that could measure this duration.
One solution is to derive such a metric by a combination of events, in this case QuoteSubmitted and QuoteProcessed. By storing the events in a DynamoDB table, indexed by the request id, we can use this table to retrieve the corresponding event and derive the metric.
The first step is to extend the Lambda function that logs the event. In addition to the logging, we now write the event to a DynamoDB table.
export const handler = async (
  event: EventBridgeEvent<'DomainEventBase', DomainEventBase>
): Promise<void> => {
  console.log({ ...event.detail.metadata, data: event.detail.data });

  // Record the event in DynamoDB
  await requestEventTableClient.putEventAsync(event.detail);
};
An example for for a single request is shown below.
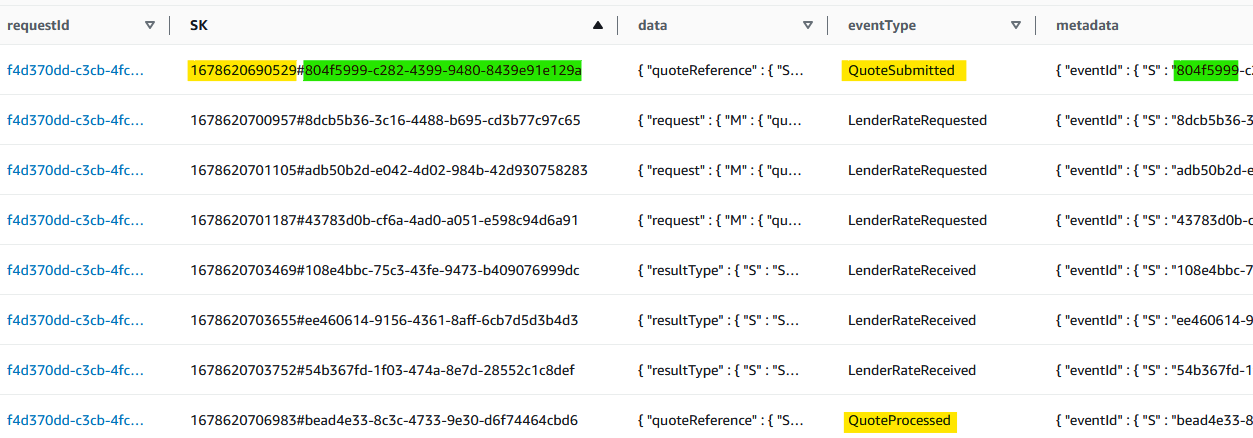
The primary key is the requestId and the sort key is a combination of the time the event was received by the logger and the eventId. This allows us to have a chronological view of the events for a particular request. In this example, we can see the requests for rates and their corresponding responses.
Now that we have a searchable log of the events, we can create a Lambda function that will use this to derive our metric. The code for this is shown below.
const publishQuoteProcessedMetricsAsync = async (
  quoteProcessed: QuoteProcessedV1
): Promise<void> => {

  // Retrieve the corresponding event for when the quote was submitted

  const [quoteSubmitted] = await requestEventTableClient.getEventsByType(
    quoteProcessed.metadata.requestId,
    EventType.QuoteSubmitted
  );

  // Calculate the duration

  const quoteSubmittedMillis = DateTime.fromISO(
    quoteSubmitted.metadata.timestamp
  ).toMillis();
  const quoteProcessedMillis = DateTime.fromISO(
    quoteProcessed.metadata.timestamp
  ).toMillis();

  const durationMillis = quoteProcessedMillis - quoteSubmittedMillis;

  // Publish the metric

  metrics.addMetric(
    QUOTE_PROCESSED_DURATION_METRIC,
    MetricUnits.Milliseconds,
    durationMillis
  );

  addMetadata(quoteProcessed, {
    quoteReference: quoteProcessed.data.quoteReference,
  });

  metrics.publishStoredMetrics();
};
By hooking this Lambda function up to the quoteProcessed event, it will start emitting metrics for the duration of processing quotes. We could extend this to derive and emit metrics for how long each lender takes to respond, or any other metric that requires correlating multiple events together.
Summary
In this post, we have seen how we can add business-level observability to our event-driven application. By taking advantage of the decoupled nature of an event-driven architecture, we were able to do this without touching the core application code at all.