
One of the big challenges of distributed systems, such as serverless, is observability. In previous posts, I had a look at structured logging, metrics, and alarms. All these play an important part in building a maintainable system. One thing that I haven't covered is distributed tracing, as I had had no experience with it. So this is a record of my first steps using X-Ray, the AWS offering you get included with your AWS account.
Please be aware there are numerous excellent third-party offerings, such as the following:
In order to dip my toe into the world of X-Ray, I decided to instrument the examples I created for my CDK Cloud Test Kit npm package. These example use a variety of services, e.g. SNS, SQS, EventBridge, etc, so provide a good starting point to learn.
API Gateway, Lambda, and EventBridge
This example consists of an API Gateway backed by a Lambda function. The Lambda function does the following:
- Generates a unique reference
- Stores the body of the request in S3, under the reference generated
- Creates a pre-signed URL, allowing access to the S3 object created
- Publishes an event to EventBridge containing the reference and the pre-signed URL
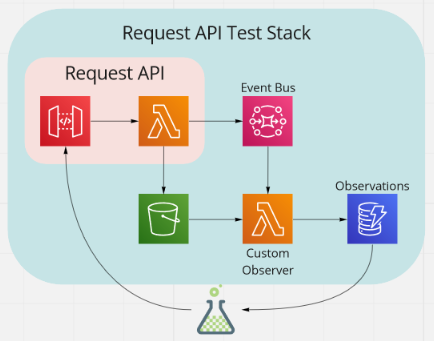
This gives us a nice example to see if we can trace requests from API Gateway, through a Lambda function, through EventBridge, to another Lambda function.
Adding X-Ray to our CDK code
The RequestApi construct contains the RestApi instance and the Lambda function it calls.
For the RestApi, we set the deployOptions property tracingEnabled to be true:
this.api = new RestApi(this, 'RequestApi', {
  // <snip>
  deployOptions: {
    tracingEnabled: true,
    // <snip>
  },
});
In the corresponding Lambda function, we set tracing to be PASS_THROUGH.
const eventPublisherFunction = new NodejsFunction(this, 'EventPublisher', {
  // <snip>
  tracing: Tracing.PASS_THROUGH,
});
The options for tracing are:
ACTIVE: Lambda will respect any tracing header it receives from an upstream service. If no tracing header is received, Lambda will sample the request based on a fixed rate.PASS_THROUGH: Lambda will only trace the request from an upstream service if it contains a tracing header with "sampled=1"DISABLED
To quote the StackOverflow post What is Active tracing mean in lambda with Xray?:
AWS Lambda supports both active and passive instrumentation. So basically you use passive instrumentation if your function handles requests that have been sampled by some other service (e.g. API gateway). In contrast, if your function gets "raw" un-sampled requests, you should use active instrumentation, so that the sampling takes place.
In our case, as the Lambda function is called from API Gateway, we can set the value to PASS_THROUGH.
However, in the RequestApiTestStack stack, we have a Lambda function that is triggered by EventBridge. Although EventBridge integrates with X-Ray, it does so passively. This means that the Lambda function receiving the event needs to have its tracing set to ACTIVE.
this.addTestFunction(
  new NodejsFunction(this, RequestApiTestStack.EventObserverId, {
    // <snip>
    tracing: Tracing.ACTIVE,
  })
);
After deploying to AWS and running a few request, the X-Ray service map view shows the following:
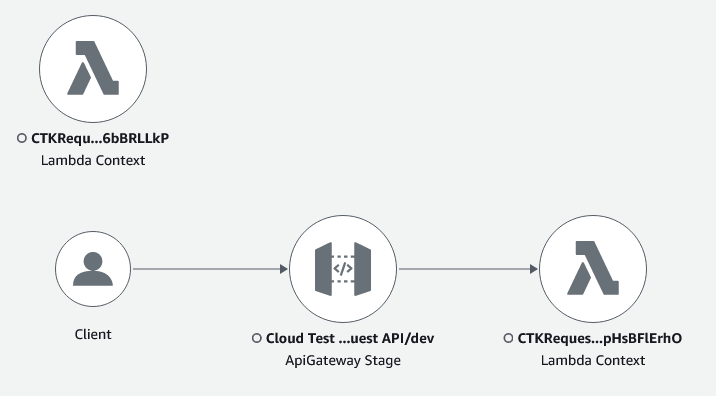
We can see API Gateway invoking the associated Lambda function, and we can also see observer Lambda function being invoked. However, clearly we are missing something that links them all together.
Adding X-Ray to our Lambda code
To get our trace linked up, we need to wrap the EventBridgeClient instance with the appropriate middleware to inject the context into the calls to publish events. This is done in the RequestApi.EventPublisher function as follows:
import * as AWSXRay from 'aws-xray-sdk';

const eventBridgeClient = AWSXRay.captureAWSv3Client(new EventBridgeClient({}));
Now when we view X-Ray, we can see the trace from API Gateway to the handle Lambda function, through EventBridge, and finally to our observer Lambda function.
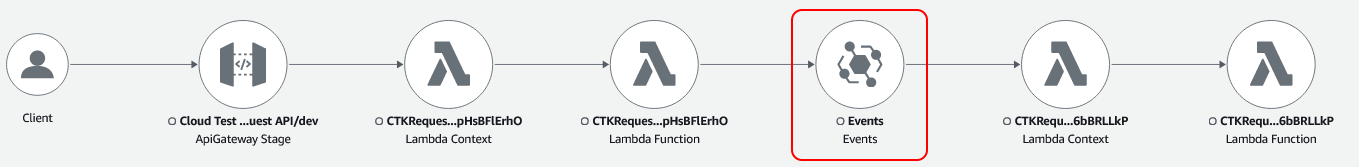
You may notice that there are two circles in the map for each Lambda function. In the video How to do Distributed tracing in AWS? | AWS X-ray and Cloudwatch Service Lens, Marcia Villalba explains that there is one for the Lambda runtime and one for the handler code.
Viewing the traces
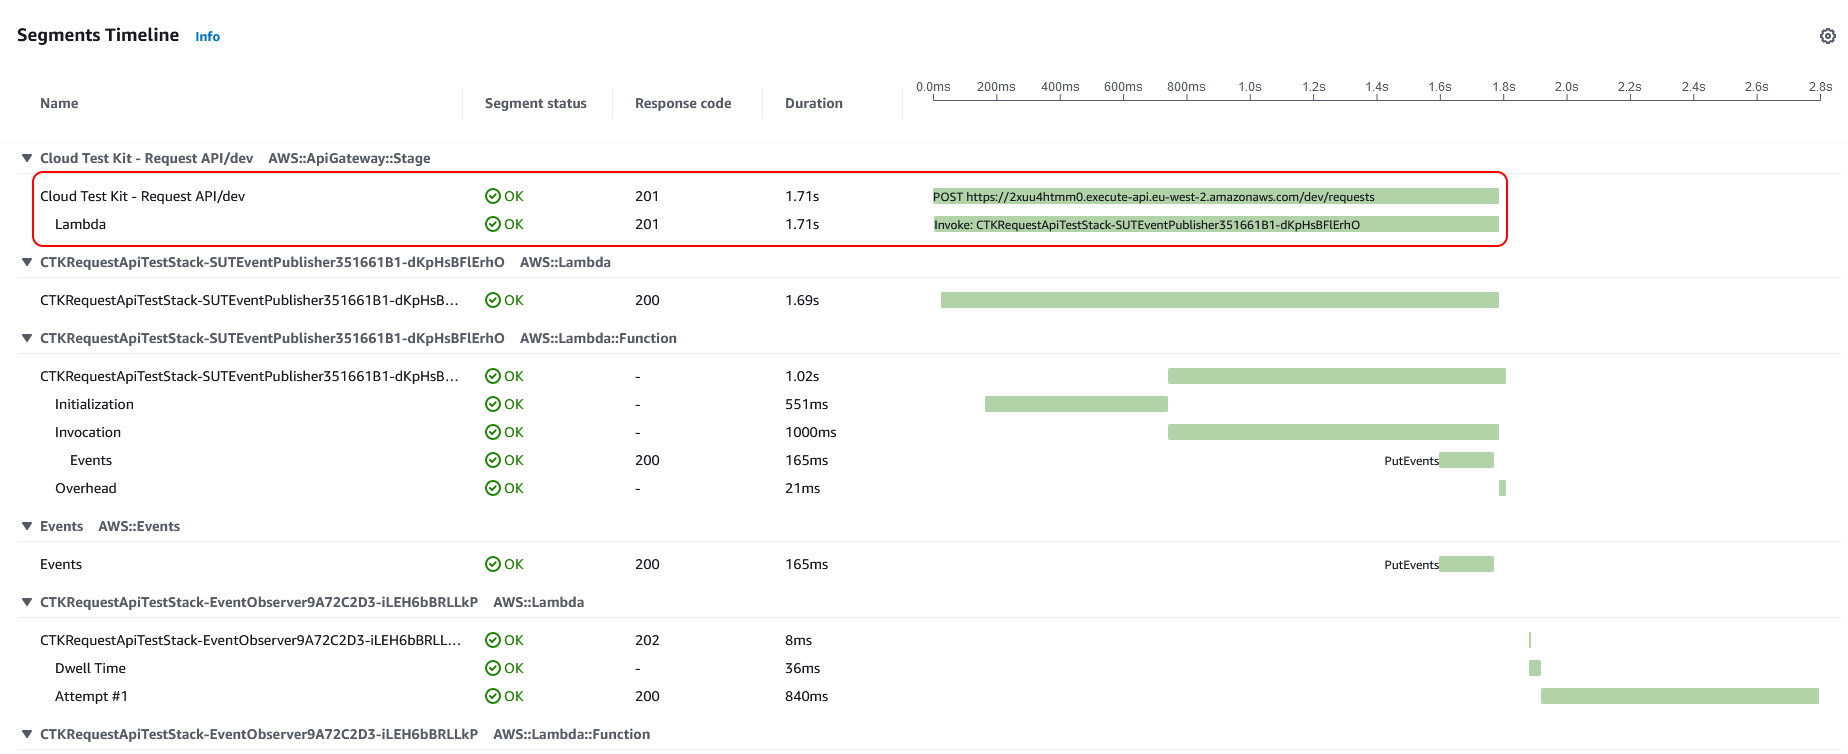
Now we have everything joined up, we can start looking at some traces to give ourself an idea of what X-Ray can do for us. Looking at the trace list, one entry jumps out as being considerably slower than the rest.
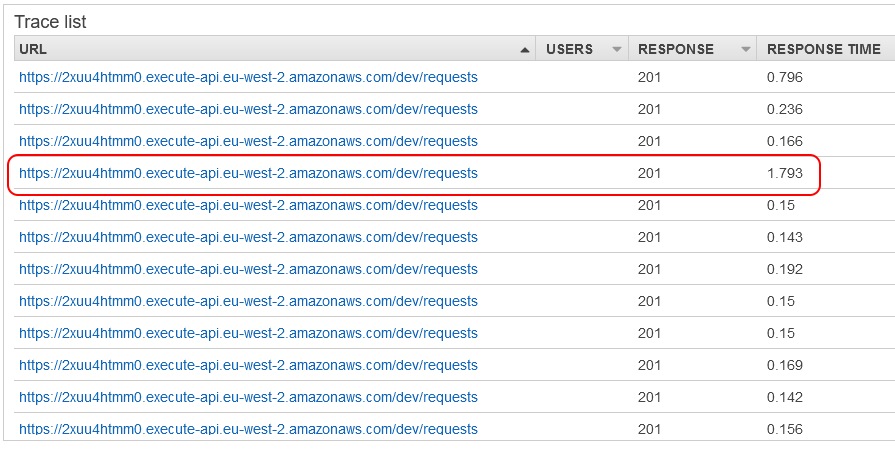
Clicking on this, we can see the following trace. We can also see the reason for why it is slower, as what we can see is a cold start in action.
If we look at a quicker trace, we can see a warmed-up Lambda function.

This small example gives a flavour of the insight that these traces can provide.
SNS and SQS
The CDK Cloud Test Kit also contains a couple of examples using SNS and SQS. This gives us a chance to add X-Ray to those and see what happens.
For the SNS example, we wrap the SNSClient in the X-Ray middleware.
const sns = AWSXRay.captureAWSv3Client(new SNSClient({}));
Running the tests, we see the following service map. This clearly shows the structure of the application, where one Lambda function publishes events to one of two topics and two Lambda functions subscribe as observers.
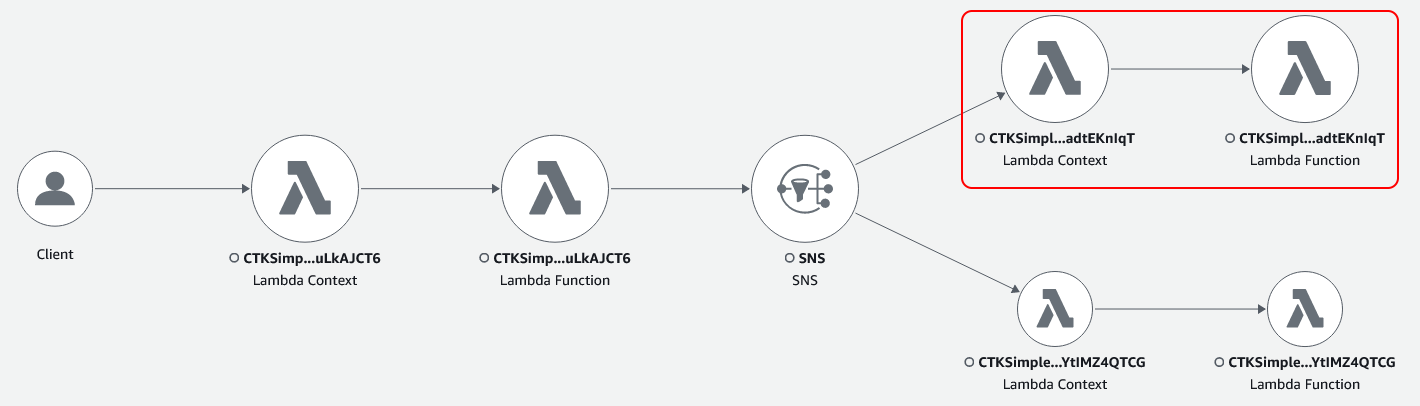
What I also noted, was that the relative sizes indicates the weight of traffic through the system. This could be useful to see if the flow within your application is as your would expect.
For SQS, we again wrap the client as we have done before.
const sqs = AWSXRay.captureAWSv3Client(new SQSClient({}));
Now when we run the tests, we see the following in X-Ray.
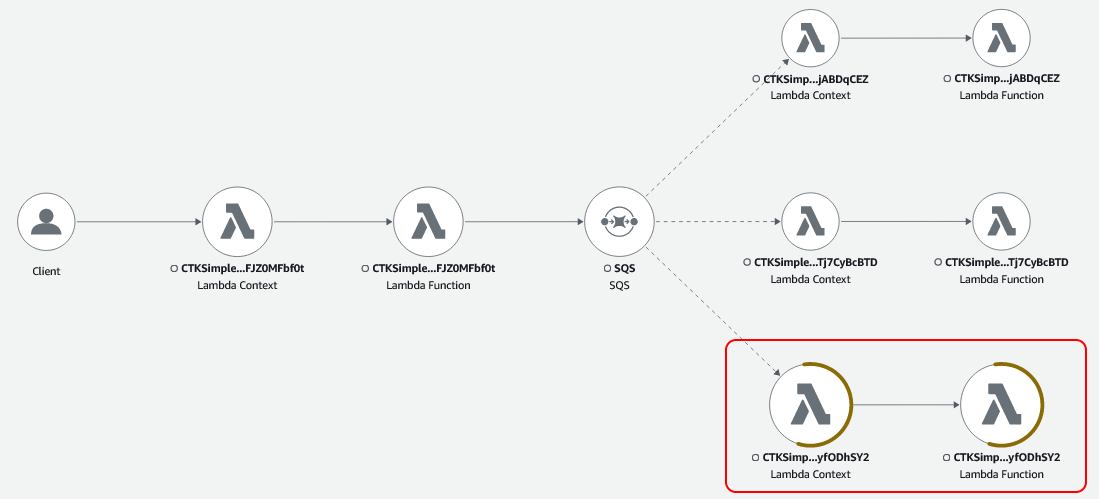
The interesting thing here is that the view includes metrics along with the service map. Two of the circles indicate that error metrics were recorded. Now if we select them, we get the option to view filtered traces.
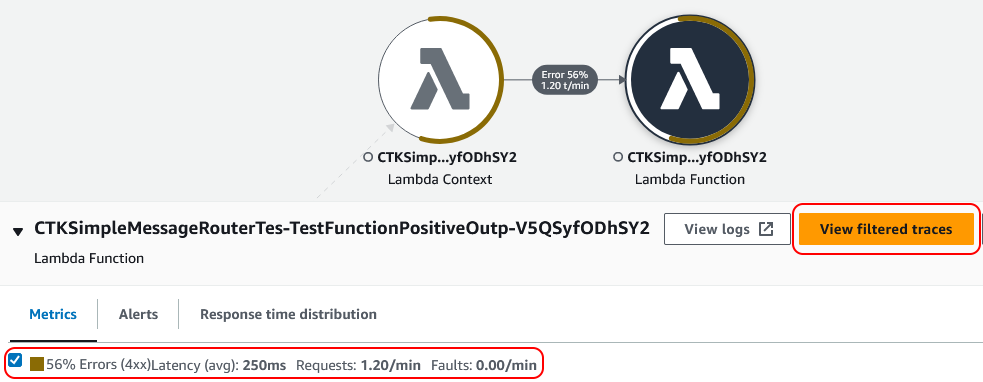
Clicking on this we get a list of traces where errors occurred.
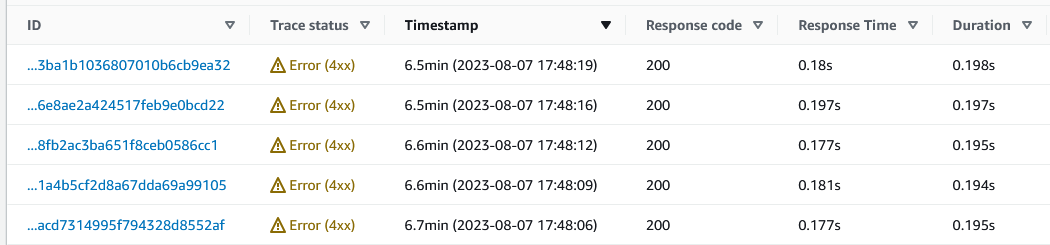
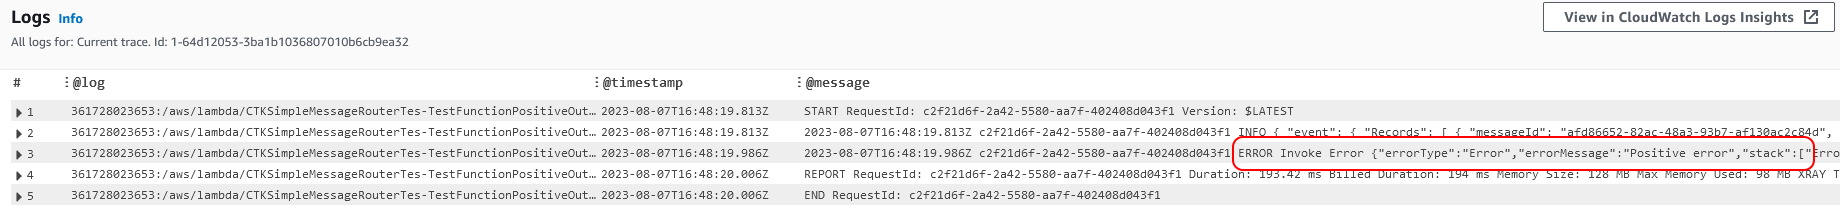
Selecting one, we go straight to the logs and we can see the error.
Hopefully, this gives you some idea of how X-Ray can help bring together traces, metrics, and logs. Allowing you to identify errors and get to the relevant logs, in order to debug issues quickly.
Step Functions
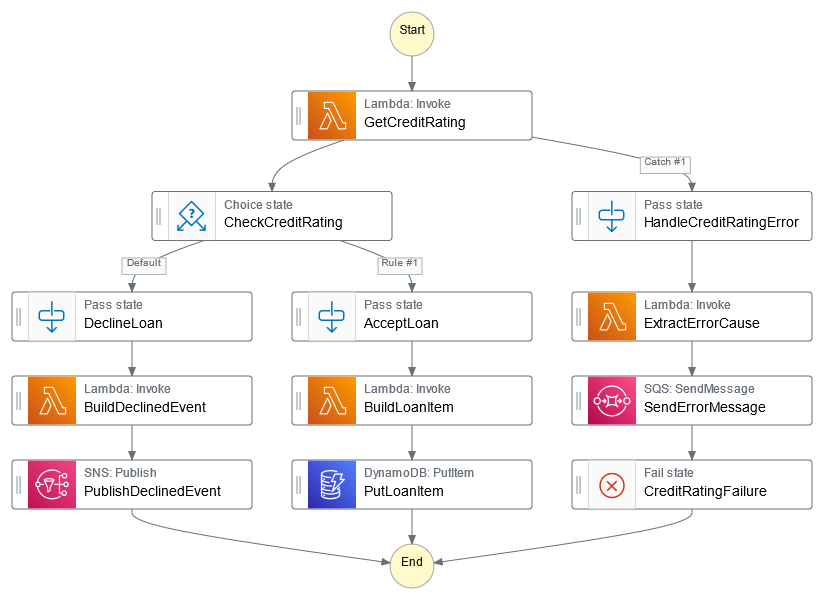
The final example that we will instrument with X-Ray is one that contains a step function. The step function implements a process that obtains a credit rating and then decides whether to accept or decline a loan. Where errors occur, a message is placed on an SQS queue. The step function definition is shown below. We can see that it includes integrations with SNS and SQS.
As well as setting the appropriate property on each Lambda function, we also need to set the tracingEnabled property to true on our step function.
export interface StateMachineProps {
    // <snip>
    /**
     * Specifies whether Amazon X-Ray tracing is enabled for this state machine.
     *
     * @default false
     */
    readonly tracingEnabled?: boolean;
    // <snip>
}
With this in place, we can deploy the updated example and run our tests that exercise all the routes through the step function. The result in X-Ray is shown below.
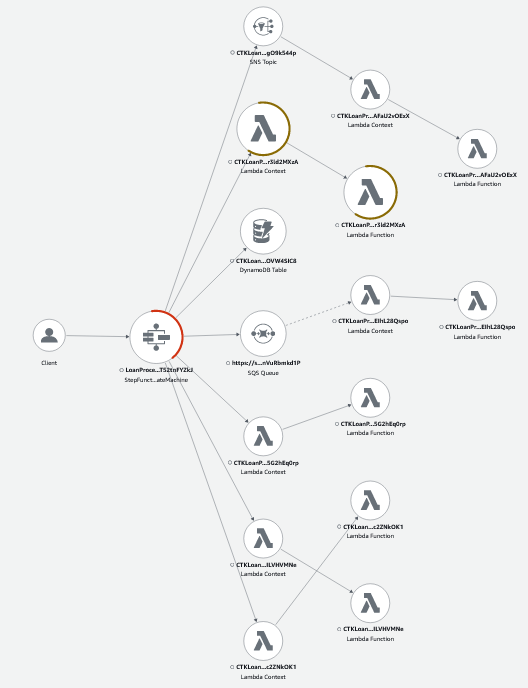
Here we can see the step function integrations with Lambda, SNS, SQS, and DynamoDB. We can see the traces go through Lambda, SNS, and SQS, but stop at DynamoDB. Although our example observes DynamoDB events, and we can see the Lambda function elsewhere in the service map, the context is lost as soon as the record is written.
Again, we can see the metrics overlaid on the service map. The tests include some error scenarios, and the resulting metrics are reflected in the highlighting of the services. Drilling into the step function service, we can view the error trace and we see the following.

Here we can clearly see the retry behaviour occurring, before the step function errors.
Summary
In this post, we looked at how we can use X-Ray to instrument a variety of services. Whilst it was simple to do, it was invasive. As in, we had to change both the CDK code and the Lambda function code. Although I haven't tried them, I believe that some of the third-party offerings avoid such changes. We also need to be aware of the cost of using X-Ray, the pricing of which can be found at AWS X-Ray pricing.
Although I feel I have only just scratched the surface, I can see how powerful X-Ray can be in the way it combines the service map, traces, metrics, alarms, and logs. In the second part of the series, I will take what I have found so far and try instrumenting my Loan Broker example application.