Deploying and Debugging my First Azure Function

In this series, I am learning by doing and documenting my experience on the way. I am aiming to build a serverless webhook proxy, to provide a resilient interface for downstream systems. In the first part, I used the local development tools to build a basic function to validate and store inbound requests. In this part, I deploy and debug the function in cloud, using the tools in Visual Studio and the Azure portal.
It's all gone south
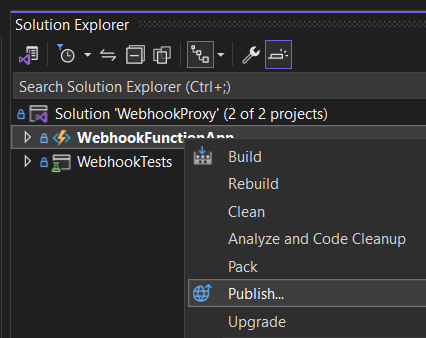
Ultimately, I want to deploy the final application using infrastructure as code. However, first I thought I would try the ClickOps approach. This is done by right-clicking on the project and selecting 'Publish'.
The first time through it did successfully publish the function to Azure. However, I did notice something odd in the wizard. At one point it asks you to create a new Functions instance. The odd thing is that it only gave me one option for the storage, and that option was on the other side of the world.
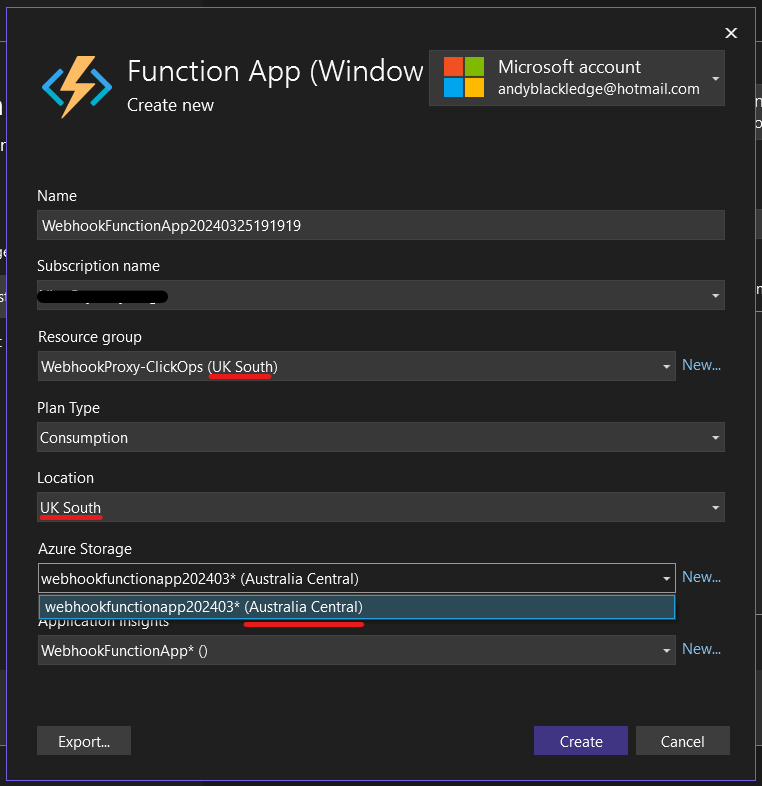
I thought that perhaps it was perhaps a user interface issue. Surely, it wouldn't create resources 12,000 miles apart. I clicked to continue and then looked at the created resources.
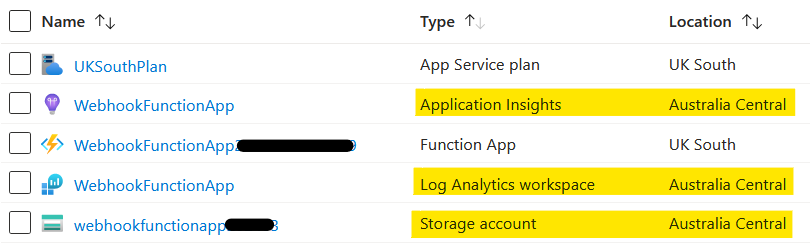
Unfortunately, it was very much the case that resources could not have been more geographically disparate if you tried.
Back to the Portal
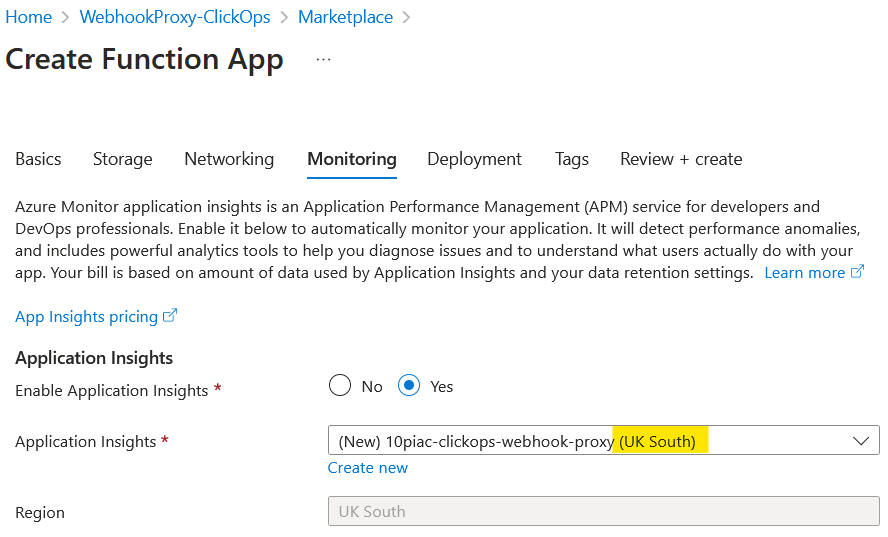
Try as I might, I could not get the Visual Studio wizard to create a set of geographically-sensible resources. Instead, I went into the Azure portal and selected the option to create a Function App. This did allow me full control over the location of any created resources. In particular, the Application Insights could now be located in the UK.
Once the Function App had been created via the portal, I could select it in the Visual Studio wizard.
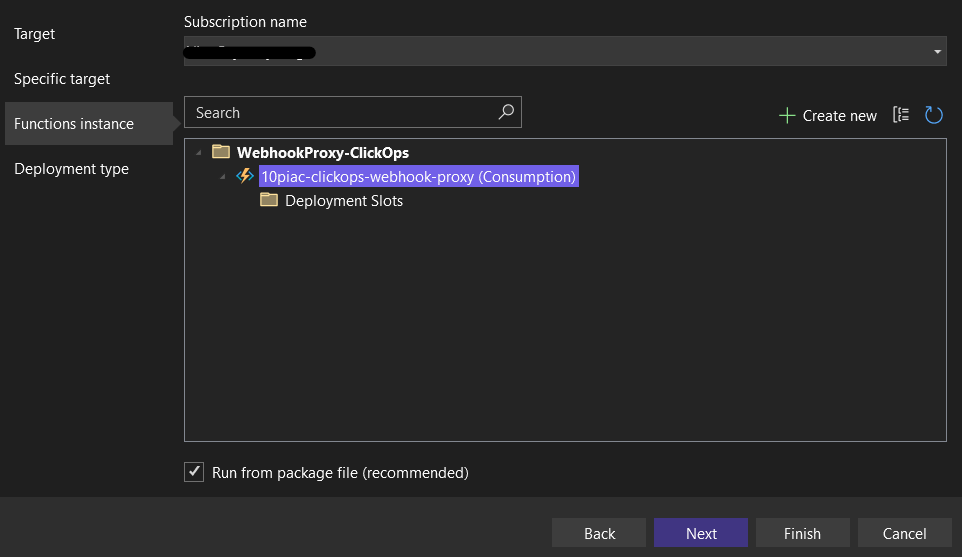
Once this wizard had completed, and generated a few interesting files, I was presented by the 'Publish' button below.
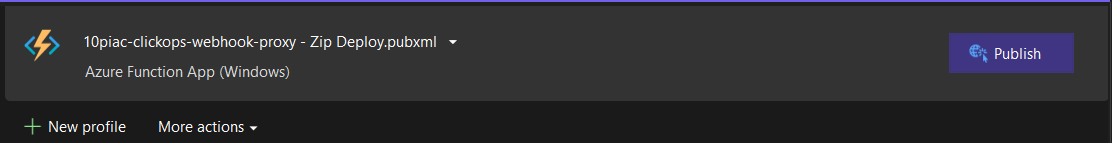
Pressing this started the deployment and, before long, I had my function deployed into the cloud and ready to be tested.
Debugging the deployment
Full of excitement, I fired off a request to the function and got the following response.
HTTP/1.1 500 Internal Server Error
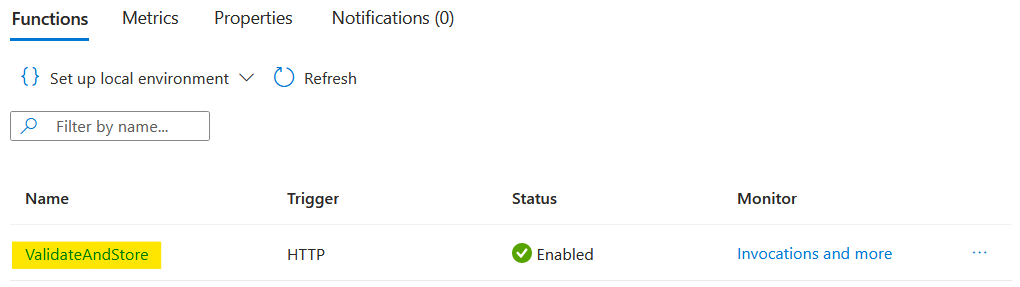
Now, I could test the function locally to recreate and debug the issue. However, it struck me that it would be an opportunity to look at what diagnostics are available in the cloud. With this in mind, I opened the Azure portal and went into the function app overview. Here, I was presented with a list of functions.
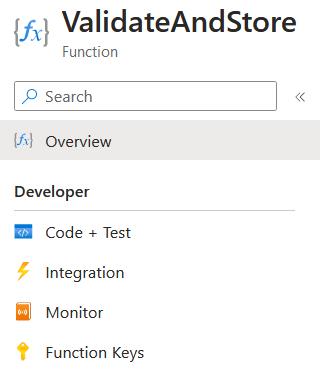
After selecting the function, I was then given the following developer options.
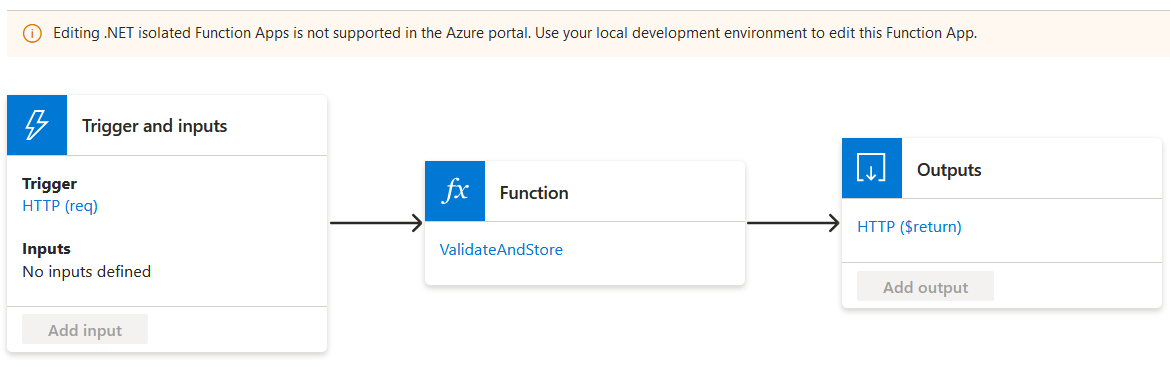
Out of curiosity, I selected the 'Integration' option and got a diagram showing how the triggers and inputs for the function and the outputs from the function. There was also a warning me that I could not edit my function in the portal, as I had chosen to use the isolated worker model. If such editing is important to you, then this is perhaps a reason not to choose that model. For me, I would rather not have the option.
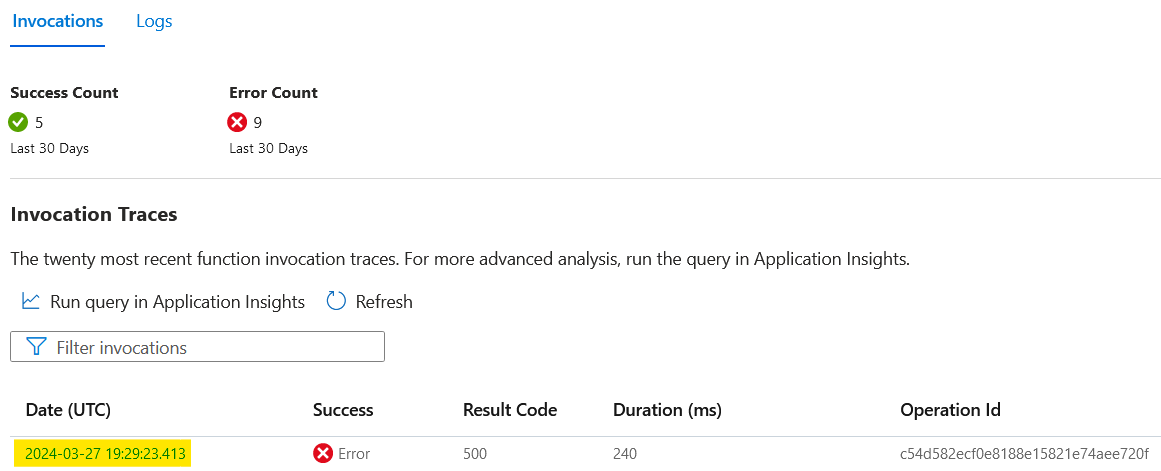
Selecting 'Monitor' resulted in a promising list of function invocations. At the top of the list was my failure.
Clicking on the hyperlinked date brought up the details that I was looking for.
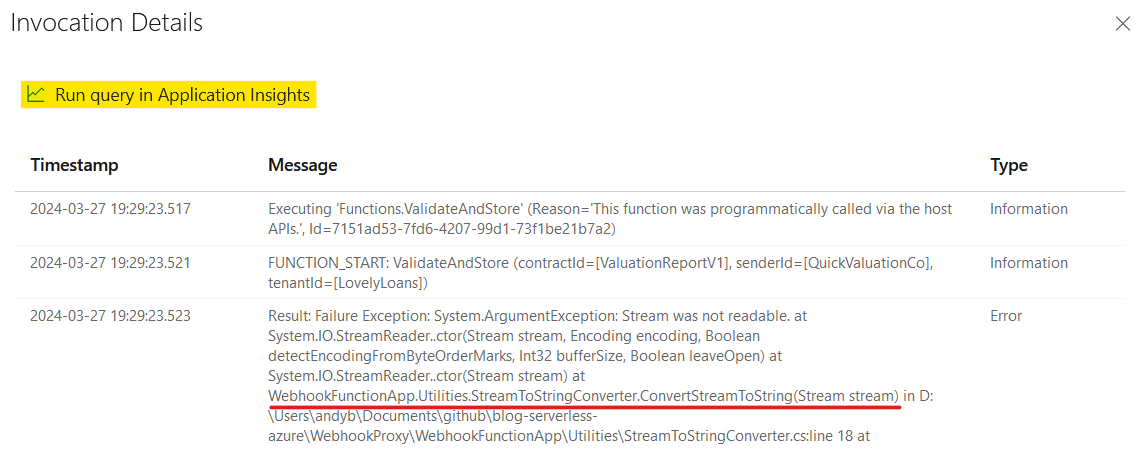
Here was the exception stack trace that clearly showed that the error lay in the code I had written. Well, the code I had copied from ChatGPT. Clearly, I had not been as diligent as I should have been with my testing.
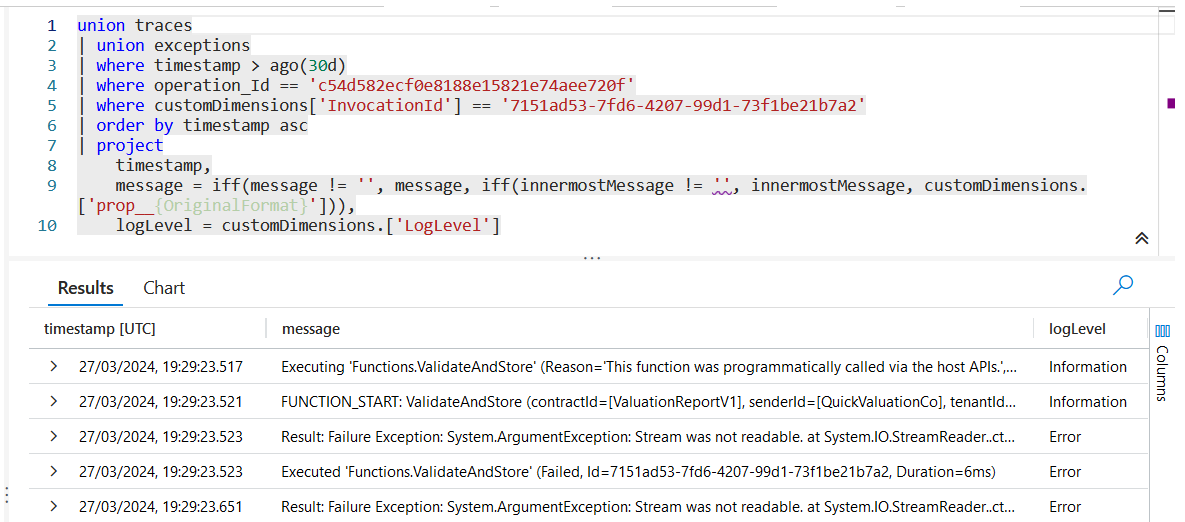
There was also an option to run a query in Application Insights. Clicking this caused the following query to run and return all the relevant entries. Note how the query uses the 'union' operator to combine data from both the traces and exceptions tables.
For completeness, I open the 'Logs' page. This appeared to be some sort of realtime view of the logs. I ran my faulty function again and saw the following entries appear.
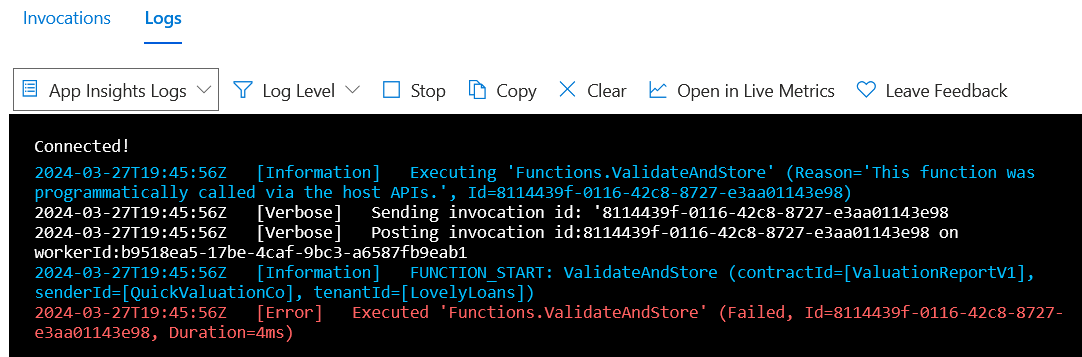
By default, it doesn't appear to log the actual exception. This seems to rather limit its usage, as the other views capture the full details. However, it might have some uses that are not apparent to me at the moment. It is good to know it is there though.
Now I knew what the problem was, I could go and fix it. But before that, there was one more thing I wanted to try and that was remote debugging.
Remote debugging (eventually)
To tell the truth, I could have saved myself quite a bit of frustration if I had read the remote debugging section of the Microsoft Develop Azure Functions using Visual Studio guide. However, here is the tale of my more circuitous route to success.
My first attempt was the most obvious option. That is, to use the option in the Publish page to attach a debugger.
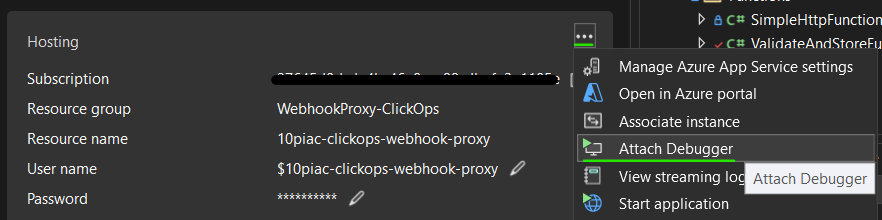
This then indicated some activity, but ultimately no attachment occurred. Undeterred, I searched the internet and found the blog post How to remote debug an HTTP trigger Azure Functions in Visual Studio 2022. Amongst the steps mentioned, was to enable remote debugging in the Azure portal. However, when I looked I found this was already enabled.
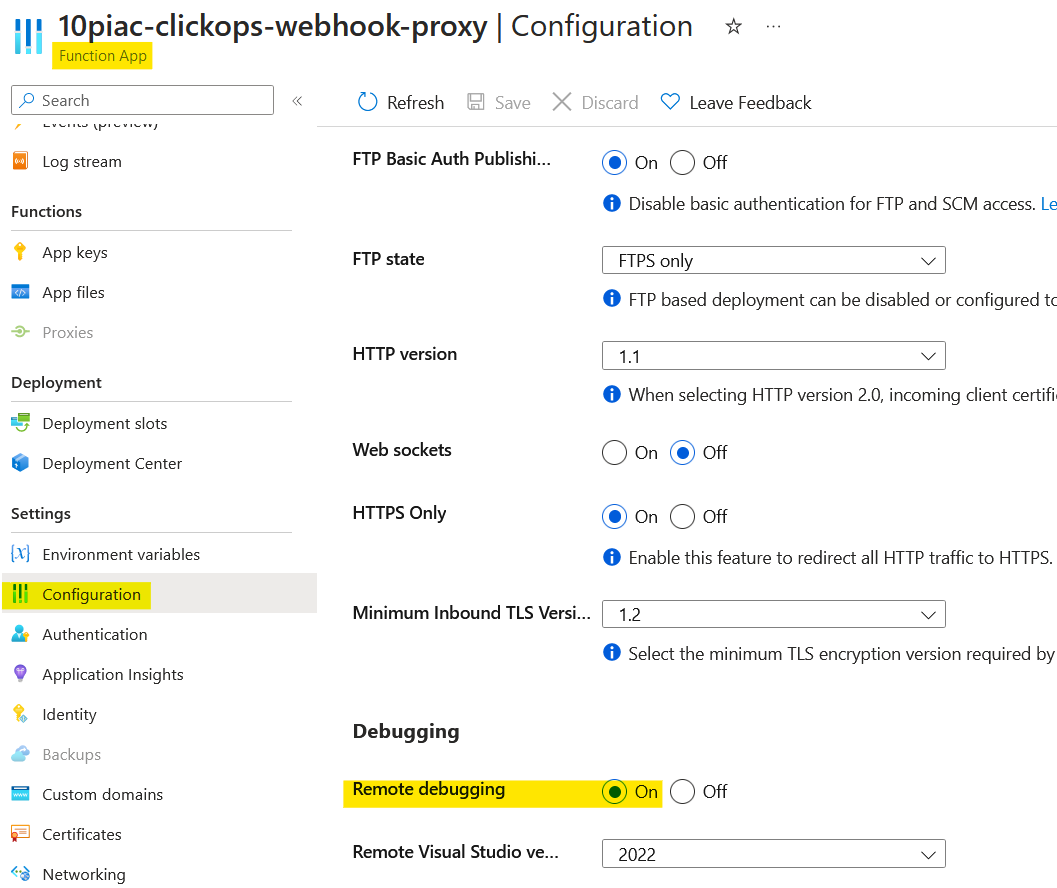
With hindsight, what I suspect had happened was that the 'Attach Debugger' operation had enabled this. The Microsoft article advises the following:
After you're done remote debugging your code, you should disable remote debugging in the Azure portal. Remote debugging is automatically disabled after 48 hours, in case you forget.
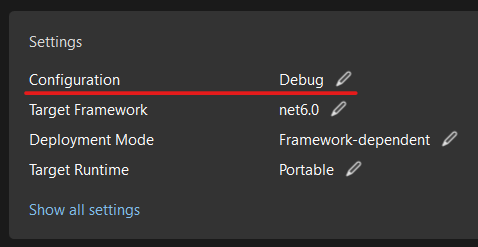
The next thing I tried was to update the publish settings. The configuration was set to 'Release', so I changed it to 'Debug'.
Following the instructions in the blog post, I tried manually attaching to the remote process and was prompted for credentials to connect.
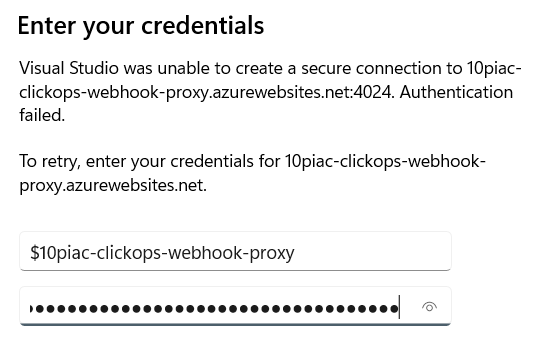
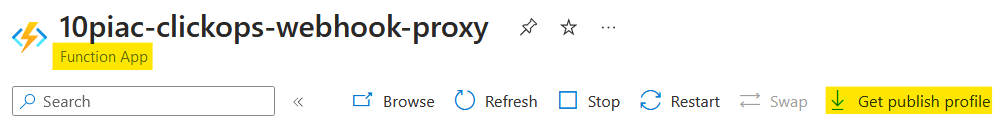
The credentials required had to be downloaded from the Azure portal, via a publish profile.
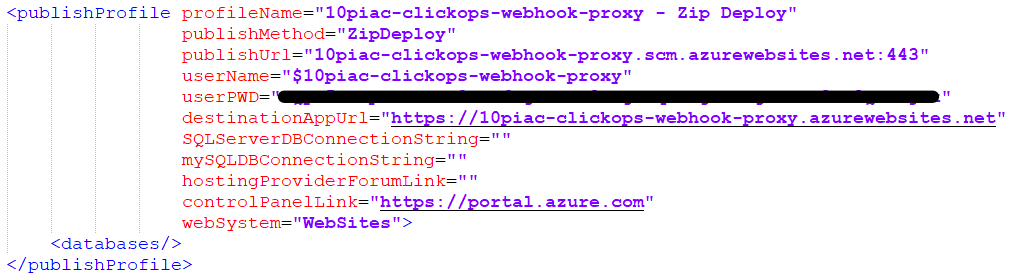
In the downloaded file, I found the details required in the 'Zip Deploy' element.
After a few tries, I was finally able to see the processes. So I followed the blog post and tried attaching to the w3wp.exe process.
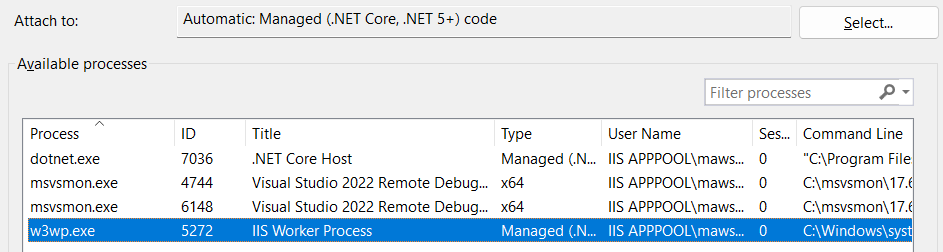
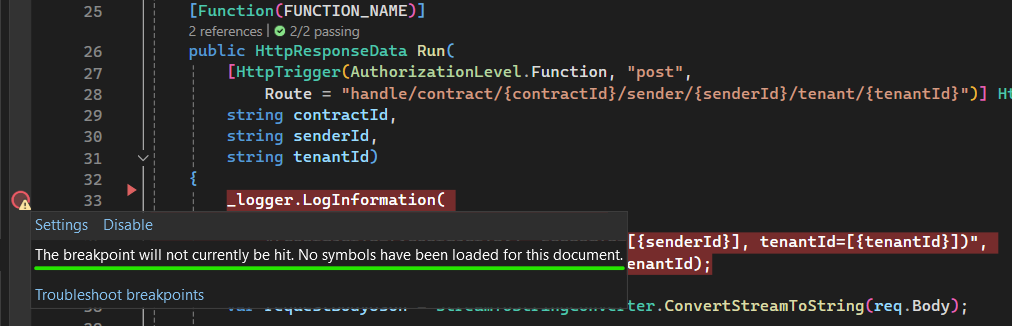
However, Visual Studio still reported that my breakpoints were not active.
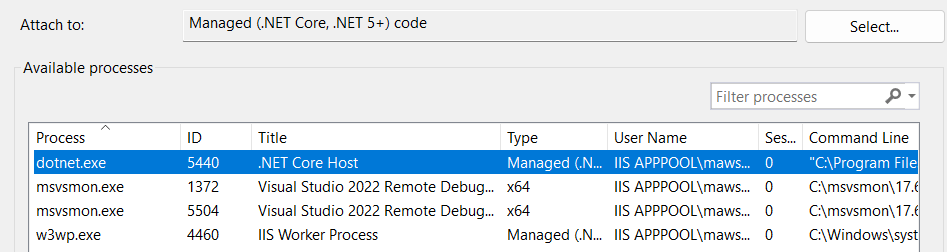
I wondered for a short while if remote debugging was not supported for the isolated worker model. Then it dawned on me that it wasn't the w3wp.exe process that I should be attaching to, it was the isolated dotnet.exe process instead.
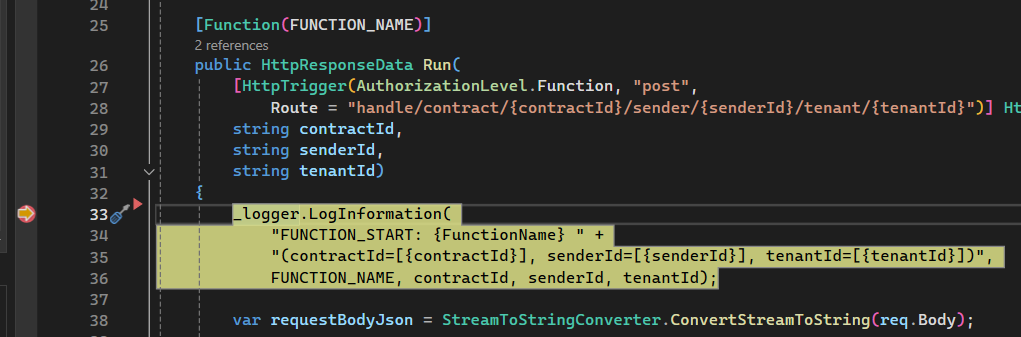
Once I had done this, everything fell into place. My breakpoint was hit and I could step through my function remotely.
As mentioned, I could have avoided this, as the Microsoft article clearly states:
Check Show process from all users and then choose dotnet.exe and select Attach.
Summary
My experience highlighted the upsides and downsides of high-level wizards. When they work, they can be very productive. However, when they don't, it can be very difficult to understand what is going on an how to fix it. I also fell foul of the changing technology, as I was reading articles for the older function model whilst using the newer model.
However, I got there in the end and the option of remote debugging is an interesting one. It is one that I have never really felt I needed with AWS Lambda functions, but perhaps I will find a use now it is available. The option does expose the internals of the isolated worker model, as you can see how there is a separate process being called from the usual w3wp.exe process. If you step through an unhandled exception, you can even see how gRPC is used to communicate. All quite different from the black box of AWS Lambda functions.