Adventures with AWS X-Ray and CDK - Part 2
Debugging an asynchronous step function

In the first part of this series, I added AWS X-Ray to a set of examples for my CDK Cloud Test Kit. In this part, I look at adding it to an example application that I put together for my series on implementing Enterprise Integration patterns. Let's see what adventures I have.
The example application
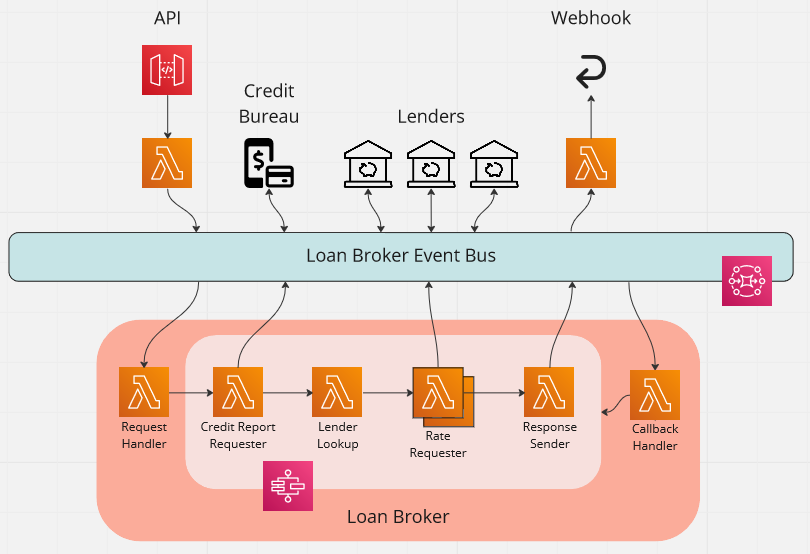
The case study we looked at in the series on implementing Enterprise Integration patterns is an application that acts as a loan broker. The application in question receives a request containing the details of the loan required via an API, and then returns the best rate to a webhook.
The following diagram shows how we use a central EventBridge event bus to implement this.
Adding X-Ray
Adding X-Ray to the application involved the following steps.
- Enable tracing via CDK
- Lambda functions
- Step functions
- Wrap SDK clients
- EventBridge
Enabling tracing on the Lambda functions was as straightforward as adding the following line to the default properties for all Lambda functions in the application.
export const NODE_DEFAULT_PROPS = {
  // <snip>
  tracing: Tracing.ACTIVE,
};
The only place I chose to override this default behaviour was in the API handler. Here I used Tracing.PASS_THROUGH, so that it would adhere to the upstream sampling set in the API. See the following StackOverflow post What is Active tracing mean in lambda with Xray? for a good explanation on what the tracing levels mean.
The application only uses one step function and so it was amended directly as follows.
this.stateMachine = new StateMachine(this, 'StateMachine', {
  tracingEnabled: true,
  // <snip>
});
The final step was to wrap all the SDK clients that make requests via passive services, such as EventBridge or SQS.
As was shown in the diagram above, all communication in the application is done through EventBridge. In fact, all Lambda functions use the same putDomainEventAsync method to send domain events.
export const putDomainEventAsync = async <T extends Record<string, any>>({
  eventBusName,
  domainEvent,
}: {
  eventBusName?: string;
  domainEvent: DomainEvent<T>;
}): Promise<AWS_EventBridge.PutEventsCommandOutput> => {
  // <snip>
};
The upshot of this is that there was only one place to wrap the EventBridge SDK client:
const eventBridge = AWSXRay.captureAWSv3Client(new EventBridge({}));
And with this, I had added X-Ray to the whole application.
Step Functions and EventBridge
One thing that I was aware of, was that the step function uses EventBridgePutEvents direct integration, as highlighted below.
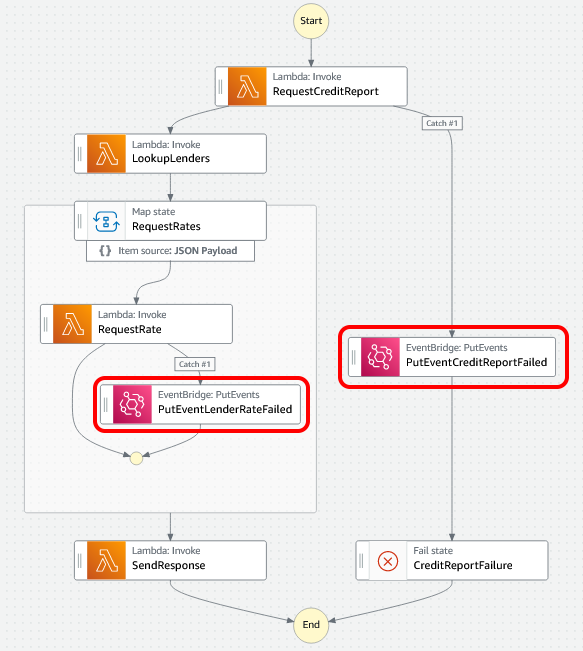
I was asking myself if this call would be traced by X-Ray. To test if this is the case, I decided to run one of the the unit tests that executes the step function.
The unit test
The unit test differs from a more traditional unit test in that it exercises the step function in the cloud as part of an ephemeral, test-specific CDK stack. This approach allows the Lambda functions used by the step function to be swapped for test-specific implementations. This allows us to script responses for those function and so test all the routes through the step function. For an in-depth look at the approach, please see my post Step Function integration testing with CDK.
The first test I tried initiates the step function by publishing a quoteSubmitted event. It then waits for a Lambda function, acting as a test observer, to receive a quoteProcessedEvent.
// Act

await putDomainEventAsync({
  eventBusName: loanBrokerEventBus.eventBusArn,
  domainEvent: quoteSubmitted,
});

// Await

const { observations: quoteProcessedObservations, timedOut } =
  await testClient.pollTestAsync({
    filterById: LoanBrokerTestStack.QuoteProcessedObserverId,
    until: async (o) => o.length > 0,
    timeoutSeconds: 30,
  });

// Assert

expect(timedOut).toBeFalsy();
However, when I ran the test, I found that it was timing out waiting for the expected event.
Why is my test failing?
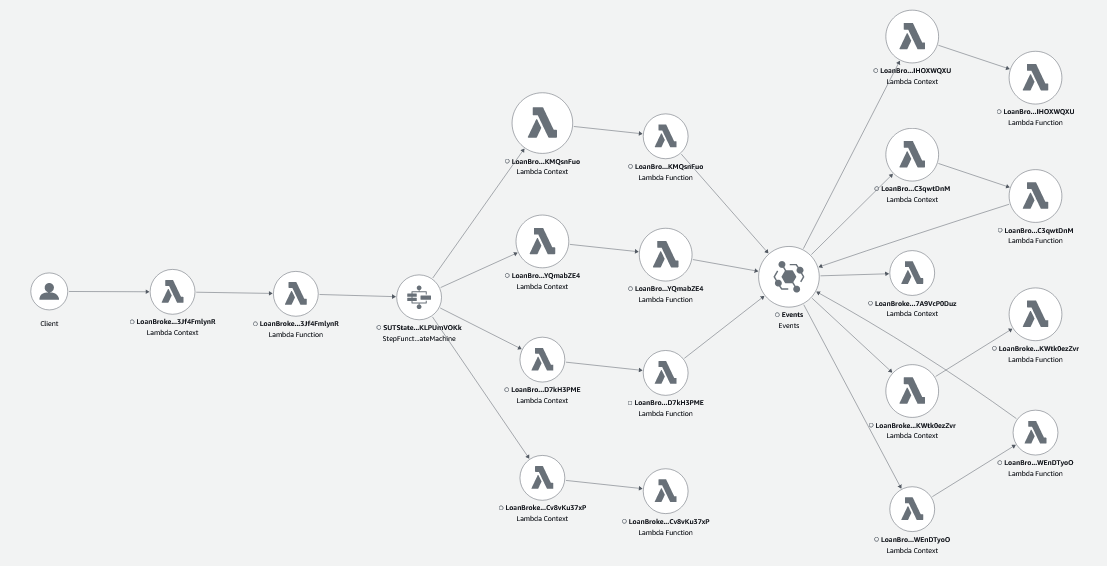
As I was now using X-Ray, I had a look at the service map.
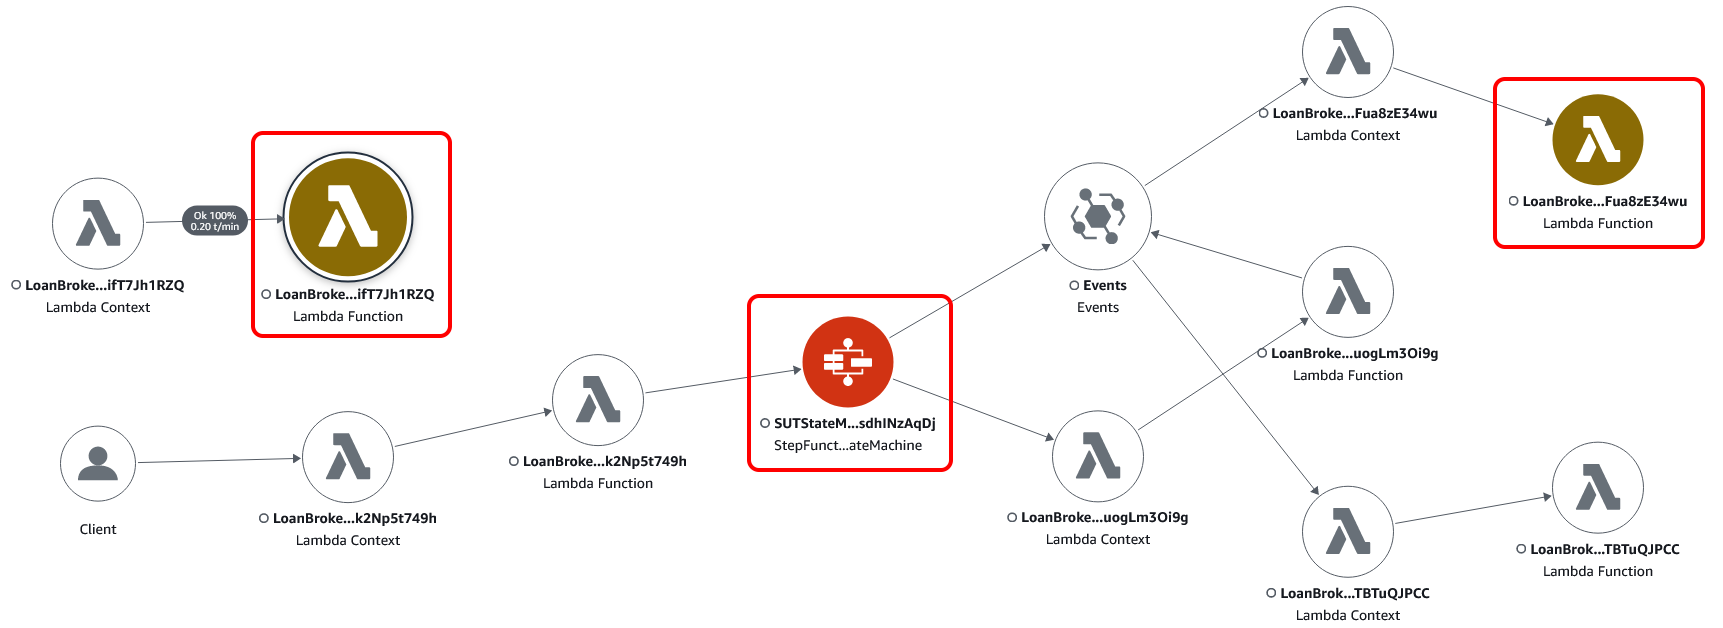
On the up side, I could see that the EventBridgePutEvents step function task does allow events to be traced through EventBridge. On the down side, I could see that there were failures in three places, the step function and two Lambda functions.
Looking at the trace for the step function, I could see that the 'RequestCreditReport' task was failing just after 6 seconds. The timeout for this task was set to 6 seconds, so this looked like the task was probably timing out. That would certainly explain why the expected event was not being published.
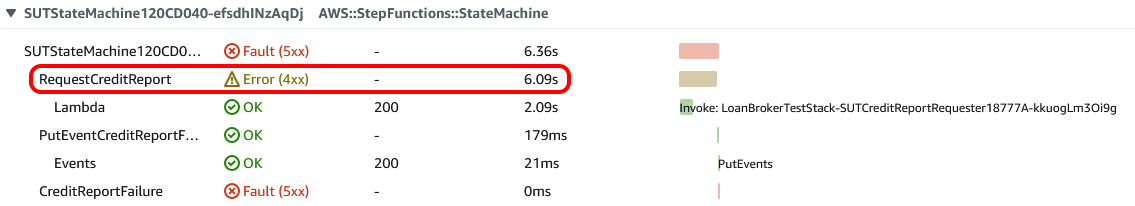
I could also see that the Lambda function that provides mock credit references was failing. This would explain why the step function task was timing out, as the step function task was never receiving an event back.
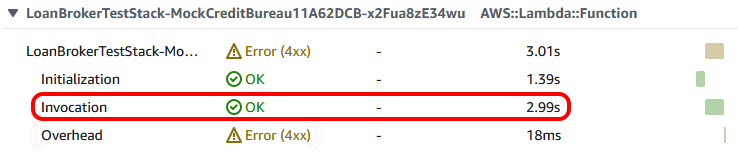
The invocation duration of 2.99s also looked like a timeout, as the timeout for Lambda functions was set to the default of 3 seconds. The console allowed me to quickly dive into the logs and confirm that that was the case.

Looking at the trace for the other failure, I could see that three attempts were made to the Lambda function that handles callbacks to the step function.
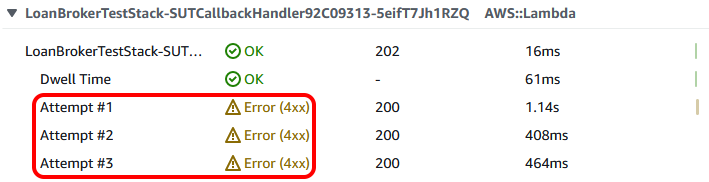
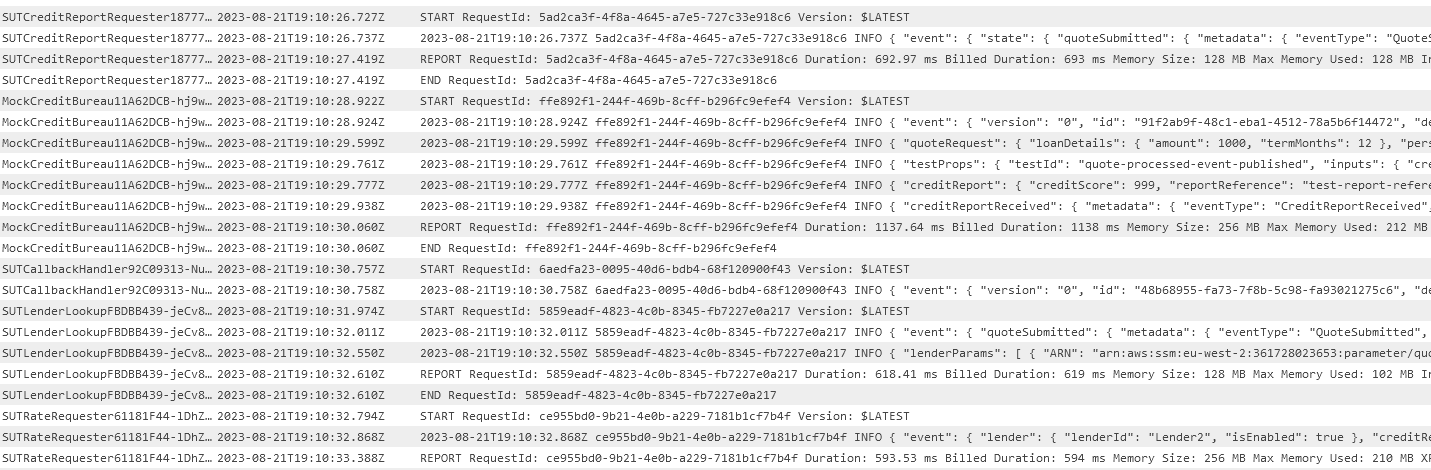
Again, I was easily able to navigate to the logs and see the reason.

I could see that the Lambda function is being invoked as the result of an EventBridge rule. The Lambda function is then trying to restart the step function, but the step function to be restarted has already finished due to the task timeout. The result is an error, which then causes EventBridge to retry.
The solution
The solution to the timeouts was quite simply to double the memory of the highlighted Lambda functions to 256mb and double the timeout to 6 seconds. With these changes in place and deployed, the unit test ran successfully and the resulting service map reflect the clean run.
This service map clearly shows how EventBridge is at the heart of our application. When I selected a successful trace, I could see all the relevant logs in one place.
Summary
Although I started this post with the intention of diving into the traces of a full application, that will have to wait until the next post.
This short exercise with the unit test shows how you can use the service map and traces to see where issues are. The integration with the logs then allows you to drill down and see the underlying reasons. In particular, X-Ray gave visibility to the asynchronous event-driven behaviour and the behaviour under failure conditions.
I am looking forward to seeing what tracing through the application will bring.
Addendum
The unit tests used a wrapped SDK client to publish events. This cause the following error to appear in the console.
console.error
  2023-08-19 14:28:41.709 +01:00 [ERROR] Error: Failed to get the current sub/segment from the context.
      at Object.contextMissingLogError [as contextMissing] (D:\Users\andyb\Documents\github\blog-enterprise-integration\node_modules\aws-xray-sdk-core\dist\lib\context_utils.js:22:27)
      <snip>
      at Object.<anonymous> (D:\Users\andyb\Documents\github\blog-enterprise-integration\tests\loan-broker\loan-broker.test.ts:178:5)
As mention in Configuring the X-Ray SDK for Node.js, the solution was to add AWS_XRAY_CONTEXT_MISSING=IGNORE_ERROR in my .env file.